<?xml version="1.0" encoding="utf-8"?>
<feed xmlns="http://www.w3.org/2005/Atom">

  <title><![CDATA[Hunchworks]]></title>
  <link href="http://hunchworks.in/atom.xml" rel="self"/>
  <link href="http://hunchworks.in/"/>
  <updated>2015-08-04T12:48:54+05:30</updated>
  <id>http://hunchworks.in/</id>
  <author>
    <name><![CDATA[Hunchworks Labs]]></name>
    
  </author>
  <generator uri="http://octopress.org/">Octopress</generator>

  
  <entry>
    <title type="html"><![CDATA[Market Neutral Statistical Arbitrage]]></title>
    <link href="http://hunchworks.in/blog/2015/05/07/market-neutral-statistical-arbitrage/"/>
    <updated>2015-05-07T15:21:22+05:30</updated>
    <id>http://hunchworks.in/blog/2015/05/07/market-neutral-statistical-arbitrage</id>
    <content type="html"><![CDATA[<p>The figure shows the profit/loss on a Rs.10,00,000 investment for the period March 1, 2014 to May 6, 2015 - a period of about 14 months (281 trading days) - using a (modified) Kalman Filter based market neutral statistical arbitrage strategy on stocks listed on the National Stock Exchange (NSE), India. These returns are not compounded - that is, the profits gained are not fed back into the strategy - the investment is a constant Rs.10,00,000.</p>

<p><img src="http://hunchworks.in/images/statarbreturns.png" /></p>

<p>
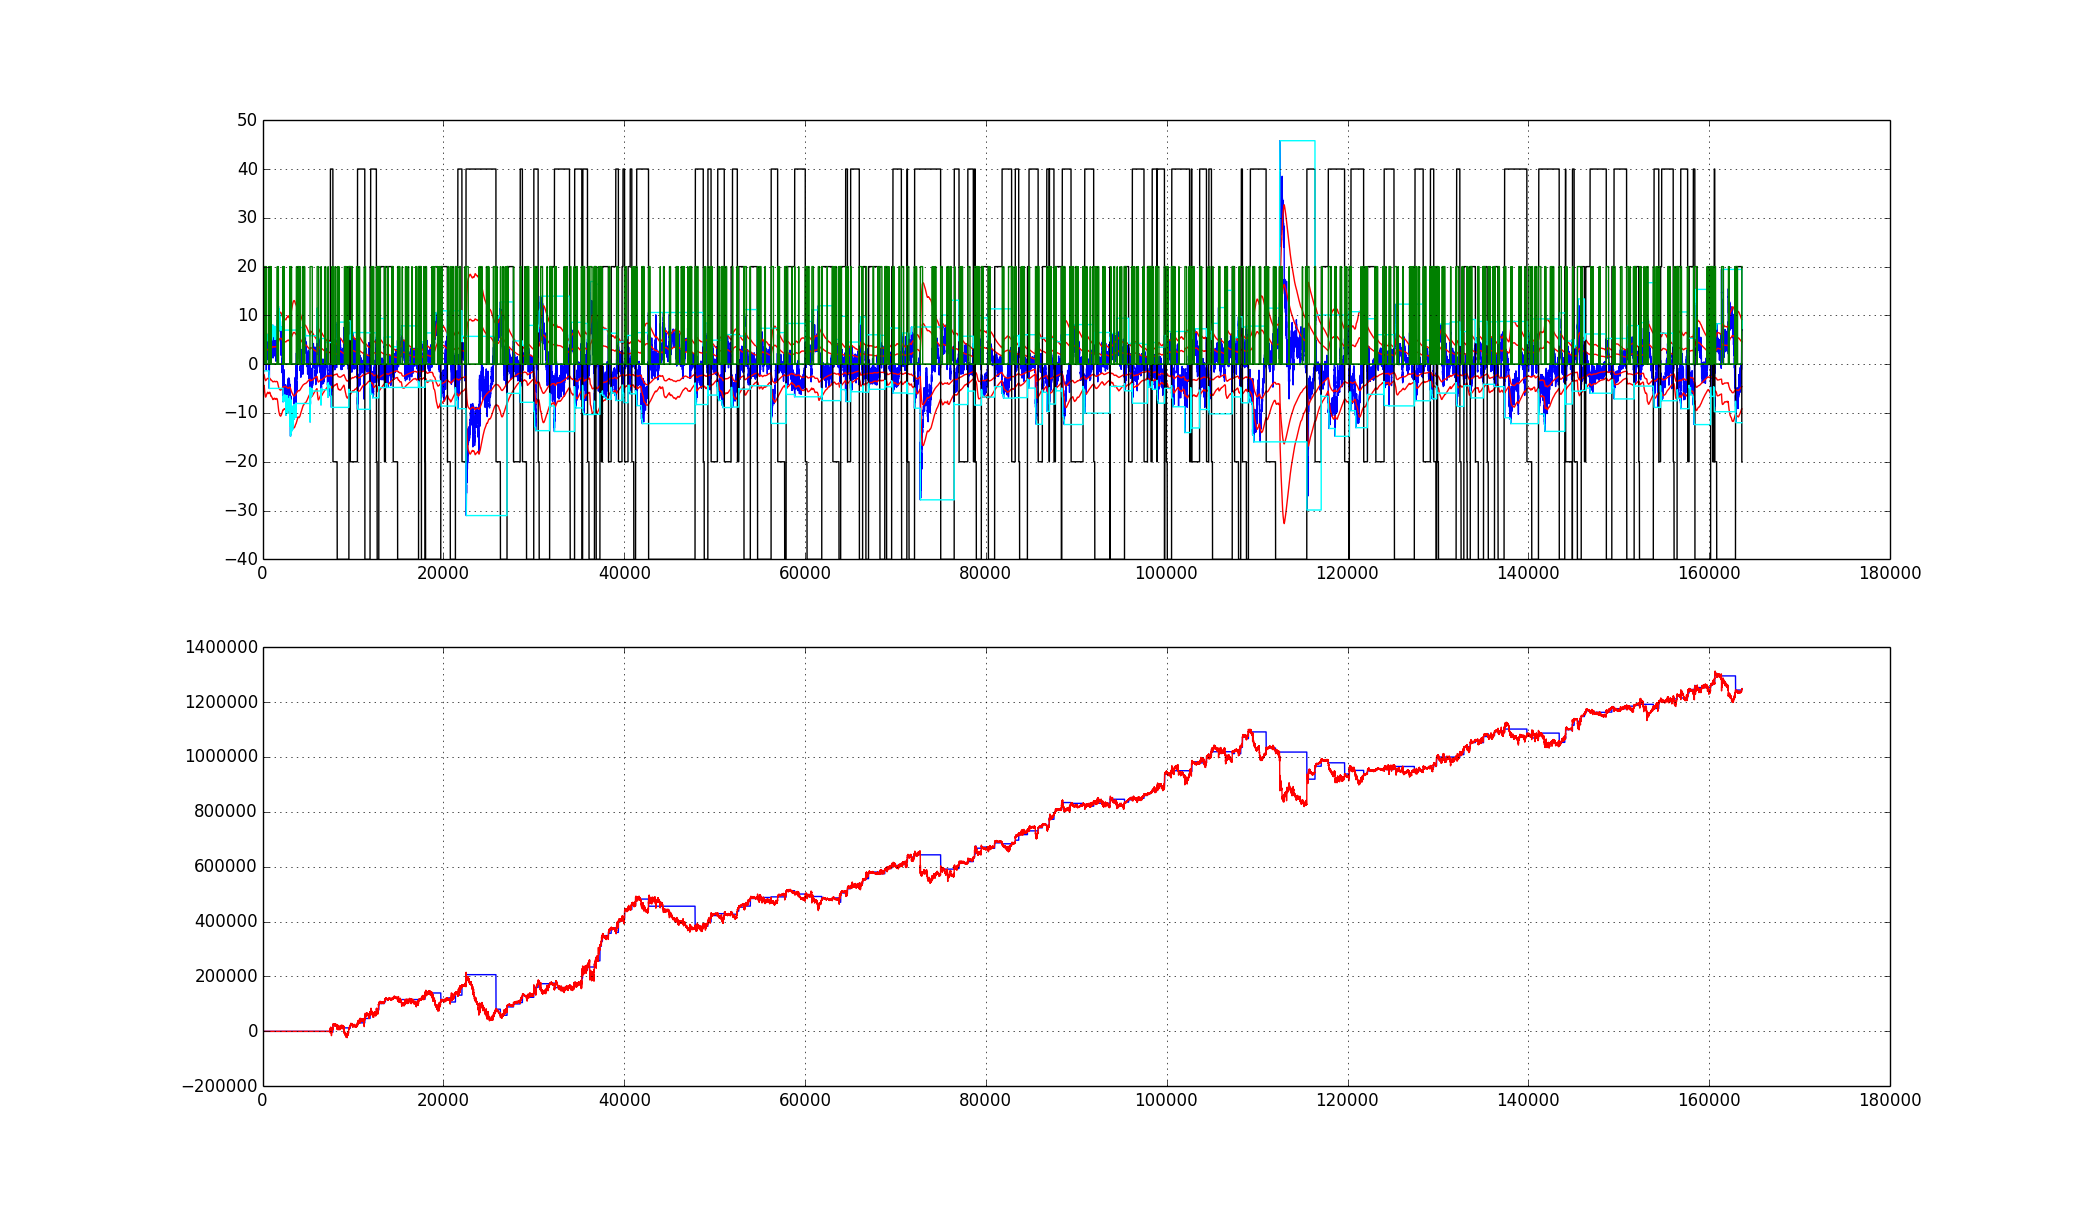
During the same period, the CNX NIFTY index went from 6526 to 8090 - a gain of about 24%. Assuming a return of 8.5% on a risk-free fixed deposit during the period, the sharpe ratio of the strategy turns out to be ~2.9, with an annual return of ~140+%.</p>

<p>Note however, that all’s not rosy during the period. The maximum drawdown during the period was ~28% - which means at some point, the strategy lost around Rs.2,80,000 from a previous peak.</p>

<p>And of course, as always, past returns are not an indication of future returns!</p>
]]></content>
  </entry>
  
</feed>
